Read the relationship
What the gold-silver ratio tells you
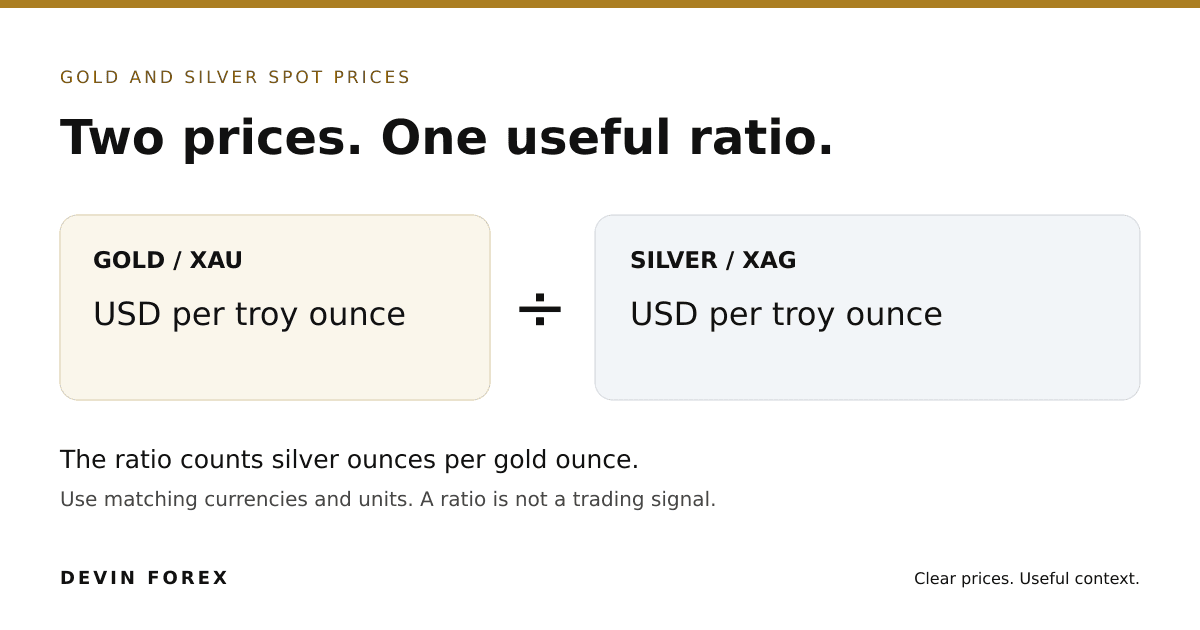
A higher ratio means gold costs more ounces of silver; a lower ratio means fewer. Hypothetically, USD 2,400 gold divided by USD 30 silver gives 80:1. Those numbers explain the maths and are not current quotes.
The relationship changes across monetary regimes, industrial cycles and periods of market stress. There is no fixed “correct” ratio, and a move away from a historical average need not reverse. A ratio alone ignores spreads, financing, taxes and the risk of both metals falling together.
What moves gold and silver differently?
| Driver | Gold | Silver |
|---|---|---|
| Dollar and real yields | Affect investment demand and the cost of holding a non-yielding asset. | Also matter, alongside sensitivity to industrial conditions. |
| Physical demand | Jewellery, investment bars and coins, and central-bank reserve purchases. | Industrial fabrication, solar cells, electronics, jewellery and investment. |
| Supply | Mine production and recycling respond on different timescales. | Often produced alongside other metals, so supply is not driven by silver prices alone. |
| Risk and liquidity | Safe-haven flows can matter, without preventing losses. | A smaller market and industrial exposure can contribute to sharper percentage swings. |
Consult the Silver Institute’s supply-and-demand research for industrial uses, and World Gold Council demand research for gold. Central-bank reserve buying is a gold-specific driver; it should not be assumed to support silver in the same way.
Comparing metal prices in South Africa
The ZAR estimate combines a USD metal quote with a dated currency reference rate. Rand weakness can lift the rand value even when the dollar metal price is unchanged. An actual South African bullion or broker quote can differ because of product premiums, spreads and applicable taxes.
If you choose derivatives, our South African trading guide explains FSCA and derivatives-provider checks. Authorisation must match the legal entity, product and client relationship; a logo or registration number alone is insufficient.
Choose your exposure before choosing a platform
Physical bullion involves ownership, custody and resale costs. Exchange-traded products depend on their structure and fees. Futures and precious-metals CFDs involve contract specifications and potentially leverage; a metal symbol alone does not identify what you own.
Read our trading-platform comparison guide for charting and order features. For the gold-only quote, purity adjustment and market explanations, use the gold price hub and value calculator. Our separate forex calculator collection covers currency contracts, not bullion ownership.
Clear answers
Gold and silver FAQs
What are the current gold and silver spot prices?
Use the two price cards above for the latest available indicative quotes. Both are USD per troy ounce, with separate UTC timestamps. Currency conversions use dated daily reference rates, so they are estimates rather than executable local-market offers.
What is the gold-silver ratio?
Divide the gold price per troy ounce by the silver price per troy ounce in the same currency. A hypothetical ratio of 80 means one ounce of gold has the spot value of 80 ounces of silver. We suppress the current ratio if either quote is stale or their timestamps are too far apart.
Why do gold and silver prices move together?
Both respond to dollar moves, interest rates and investment demand. Silver also has substantial industrial uses, so manufacturing and technology demand can pull it away from gold. Their correlation changes over time.
Is silver more volatile than gold?
Silver often has larger percentage swings, partly because its market is smaller and industrial demand matters more. That is a tendency, not a promise for every period. Compare percentage changes over matching dates rather than the metals’ dollar prices.
What is the difference between spot price and dealer price?
Spot is a metal-market reference. A dealer’s price reflects the particular product, premium or discount, buy-sell spread, taxes and delivery costs. The same budget can buy different quantities from different dealers.
Can I trade gold and silver without buying physical metal?
Some regulated markets offer metal-backed exchange-traded products, futures or CFDs. Availability depends on your country and provider. These products differ in ownership, margin, financing and counterparty exposure; CFDs do not give you ownership of bullion.
Know what you’re looking at
Data sources, timing and corrections
- Metal quotes: Gold API documentation describes USD spot references per troy ounce. Its UTC update time records a source fetch. This is an indicative feed with no independently verified exchange delay or executable bid/ask.
- Currency conversions: Frankfurter’s daily reference-rate documentation explains its central-bank-sourced blended rates. We request the last completed UTC date and show the actual returned date; this is not live FX.
- History: Provider daily averages are separate from live quotes. Intraday history is not connected. Where historical access or coverage is missing, charts and returns say unavailable. We do not join a current quote to a daily series or manufacture an all-time high.
The current ratio uses recent, time-aligned USD quotes. Performance comparisons use matching daily-average conventions, avoiding a misleading comparison between gold’s dollar move and silver’s percentage move. Quotes older than five minutes are marked stale; the ratio is withheld if quote times differ by more than one minute.
Editorial copy and calculation rules are maintained separately from provider timestamps. See our research methodology and how to request a correction. Public source documentation and calculations were checked on 7 November 2026. Nothing here guarantees availability or a trading result.